CPC Map Tool: Go Local to Go Big with Your PPC Campaign
September 3, 2018
The day has finally come. We are proud to introduce our brand new and very promising tool — CPC Map — and offer you the chance to make an evolutionary leap in your local advertising campaigns.
What Is It for?
If you target multiple locations within one country, it can be worth knowing the costs of advertising on a local level. However, guessing which areas will be the most receptive and affordable to advertise in seems like spinning a coin.
CPC Map provides an easy way to evaluate the potential of a particular state or region in terms of cost per click and search demand for your services. The tool allows you to compare PPC costs and search volume of keywords on a local level in multiple industries.
With the CPC Map tool you can:
Analyze advertising costs across different states or regions side by side
Compare both PPC costs (avg. CPC) and PPC demand (avg. search volume) in the 17 most popular niches: from Banking and Legal to Fashion and Sport
Explore your industry in detail by checking its most expensive and popular keywords
Currently the data is available for:
United States
United Kingdom
Canada
Australia
India
Italy
Brazil
South Africa
Russia
Also France, Germany, Austria, and Spain are coming soon!
How Does It Work?
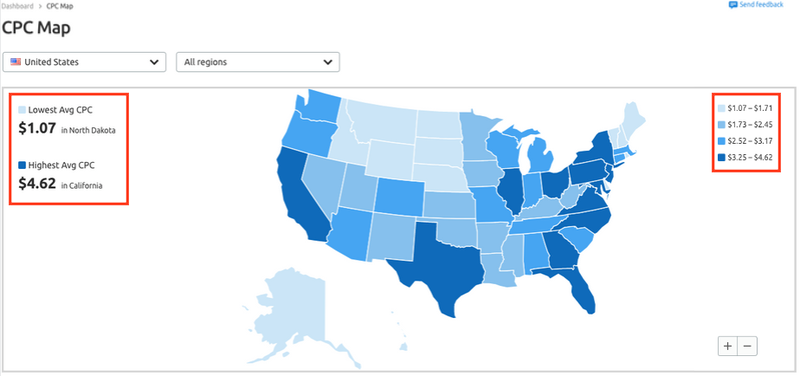
The tool presents an interactive map with the regions of your selected country color-coded by the average CPC of advertising.
To the left you will see the states/regions with the minimum and maximum average CPC in a selected country. Use the information on the right-hand side to estimate how much the costs of advertising vary state-by-state. If you select a region from the drop-down menu, you can compare its average to the minimum and maximum for the country.
You can also click around on regions to view CPC in your location. The data at the bottom of the report will change to reflect the region you clicked on. Zoom in to get a closer look at each location’s averages.
If you want to analyze your industry in detail, use data provided at the bottom of the report. You can check each industry’s advertising costs and demand in a selected region/state or in the entire country.
Switch between regions to compare average CPC and average search volume in different areas for your specific niche. Check the most expensive and popular keywords related to your business in a selected region. While performing your analysis, you may find out that the most expensive keywords are not the same as the most popular ones.
The report also shows a trend graph, on which you can see how the average CPC and volume change over time in a selected industry and region.
The CPC Map tool is a perfect place to find unlimited ideas for A/B testing and experiments, discover “hidden gems”, a.k.a. keywords with high search volume and moderate CPC, and understand which locations will be the easiest to target, so you can focus your efforts in the right direction. We’re very excited about the release of our CPC Map and can’t wait to hear your ideas, comments and suggestions for improving the service. Feel free to share your thoughts about the new tool at cpc.map@sr03.myamztools.com. Thank you for helping us grow and make SEMrush better!
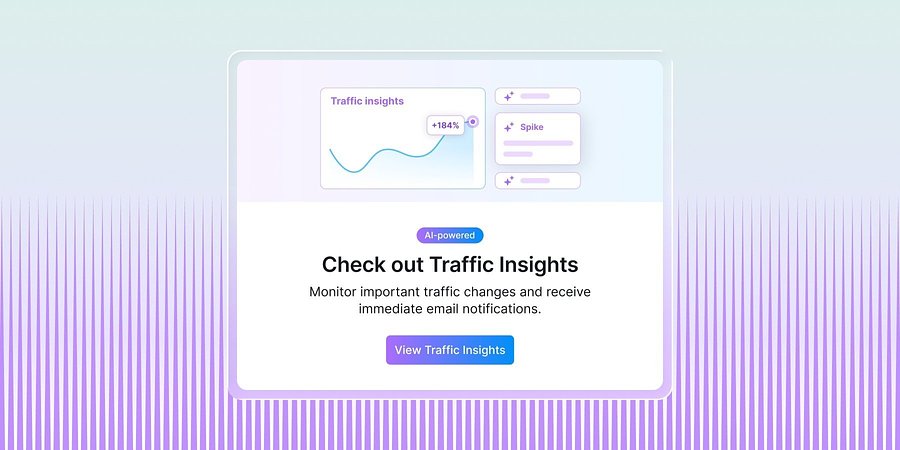
Semrush’s New Traffic Insights Explains Changes In Competitor Traffic Performance
New AI-powered Traffic Insights in Traffic Analytics help teams identify competitor traffic spikes and drops, understand the drivers, and act faster.
Product News
June 11, 2026
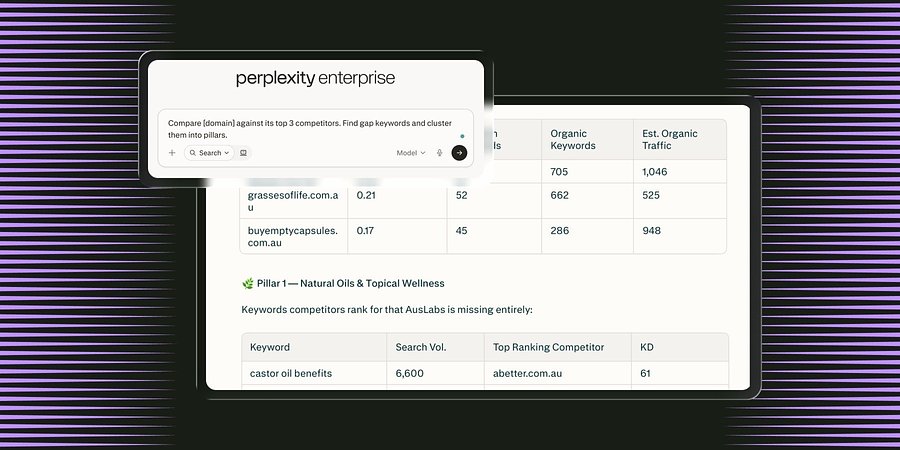
Semrush Launches MCP Connector in Perplexity, Integrating Search Intelligence Within the AI Search Engine
The new Model Context Protocol (MCP) connector enables all Perplexity users in Computer to access Semrush’s search intelligence data natively inside the LLM platform to boost brand visibility.
Product News
June 3, 2026
Semrush for Enterprise Unifies Content Optimization Capabilities Across SEO and AI Search
New workflows shared between Enterprise SEO and AI Optimization enable teams to grow brand visibility through high-performing content for both search channels.